Sign up for FlowVella
Sign up with FacebookAlready have an account? Sign in now
By registering you are agreeing to our
Terms of Service
Loading Flow

Downloading Image /
Downloading Image /
Downloading Image /
Point of Intersection
Place Image Here

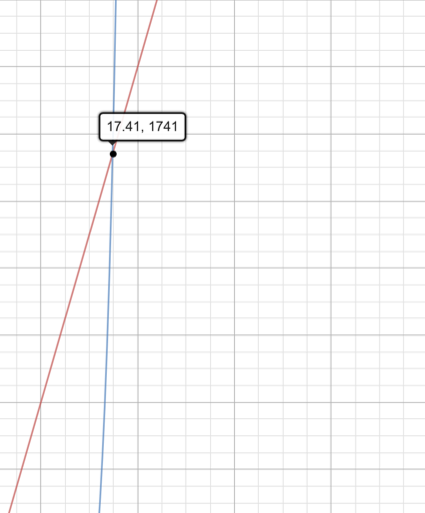
The two lines seem to intercept at about the 17th day.The blue graph represents the 2nd option and the red represents the 1st option. The blue option represents a exponential graph and the red graph represents a constant graph.
Downloading Image /
Downloading Image /
Downloading Image /
Downloading Image /

FlowVella, Previously Known As Flowboard
© 2024 FlowVella
