Sign up for FlowVella
Sign up with FacebookAlready have an account? Sign in now
By registering you are agreeing to our
Terms of Service
Loading Flow

Downloading Image /
Downloading Image /
Downloading Image /
Downloading Image /
Downloading Image /

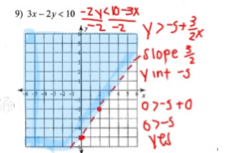
Find the slope and y-intercept and plot them on the graph
Graphing linear inequalities and shading
To make the line, you need to see if it will be a solid or dashed line. If dashed, it will be a < or > equation. If solid it will be a ≥ or ≤ equation.
Next, test the point (0,0), if the statement is true, shade in the side that has the points (0,0).
Downloading Image /

FlowVella, Previously Known As Flowboard
© 2026 FlowVella
