Sign up for FlowVella
Sign up with FacebookAlready have an account? Sign in now
By registering you are agreeing to our
Terms of Service
Loading Flow

Downloading Image /
Downloading Image /
Downloading Image /
Downloading Image /
Downloading Image /
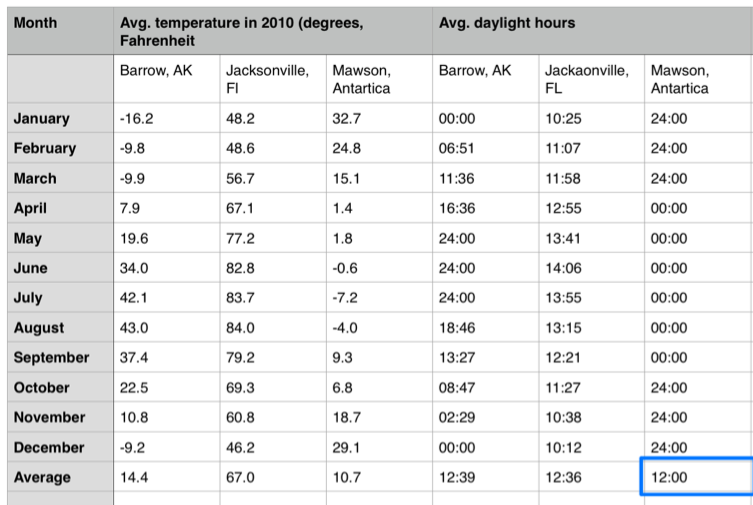
This chart shows the average temperature and average daylight hours in Barrow, Jacksonville, and Antarctica throughout the year of 2010.
Downloading Image /
Downloading Image /
Downloading Image /
Downloading Image /
Downloading Image /
Downloading Image /
Downloading Image /

FlowVella, Previously Known As Flowboard
© 2024 FlowVella
