Sign up for FlowVella
Sign up with FacebookAlready have an account? Sign in now
By registering you are agreeing to our
Terms of Service
Loading Flow

Downloading Image /
Downloading Image /
Downloading Image /
Downloading Image /
Downloading Image /
Downloading Image /
Downloading Image /
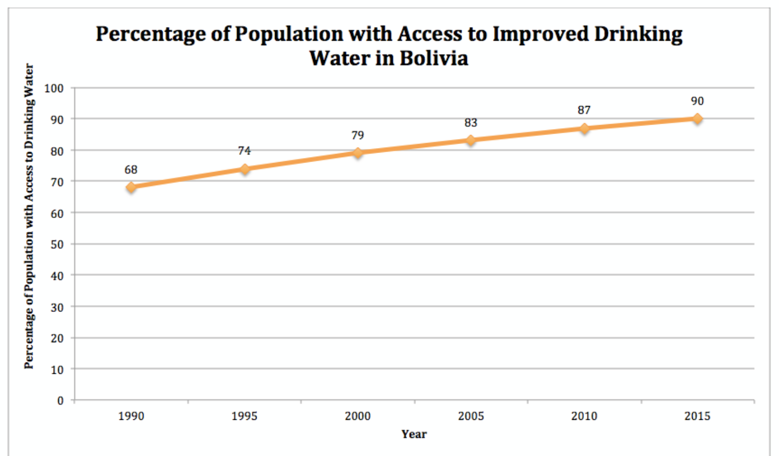
This graph shows the percentage of population with access to drinking water in Bolivia between 1990-2015. You can indicate that the percentages are increasing. We are hoping to help increase that percentage to 100%.
Downloading Image /
Downloading Image /
Downloading Image /

FlowVella, Previously Known As Flowboard
© 2025 FlowVella
