Sign up for FlowVella
Sign up with FacebookAlready have an account? Sign in now
By registering you are agreeing to our
Terms of Service
Loading Flow

Downloading Image /
Downloading Image /
Downloading Image /
Downloading Image /

Edwin Chargaff


Erwin Chargaff
Erwin Chargaff found out the amount of each base pair in several DNA


Diagram illustrating my creative process
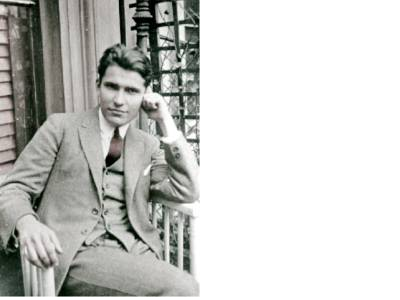
He created the T and A, and the C and G correlations.
Downloading Image /
Downloading Image /

FlowVella, Previously Known As Flowboard
© 2025 FlowVella
