Sign up for FlowVella
Sign up with FacebookAlready have an account? Sign in now
By registering you are agreeing to our
Terms of Service
Loading Flow

Downloading Image /
Downloading Image /
Downloading Image /
Downloading Image /
Downloading Image /
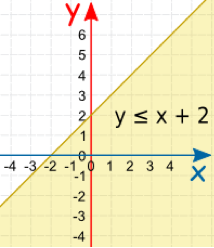
Graphing Linear Inequalities
• You find the y intercept and slope. Then graph the y intercept and do rise over run with the slope.
• After you graph the points, you draw a line:
• dashed line- if it's greater than or less than
• solid line- if it's greater than or equal to or less than or equal to
• Then you shade one side of the graph. Test the point (0,0) and if the answer is correct then you shade that side.
•example: (0,0) is less than x+2
Downloading Image /

FlowVella, Previously Known As Flowboard
© 2025 FlowVella
