Sign up for FlowVella
Sign up with FacebookAlready have an account? Sign in now
By registering you are agreeing to our
Terms of Service
Loading Flow


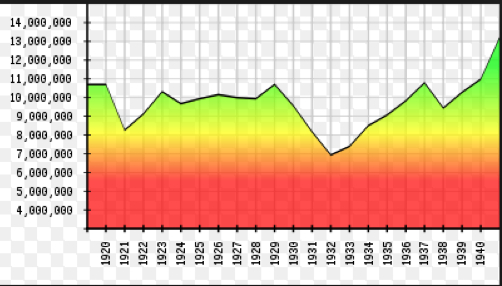
1920-1940
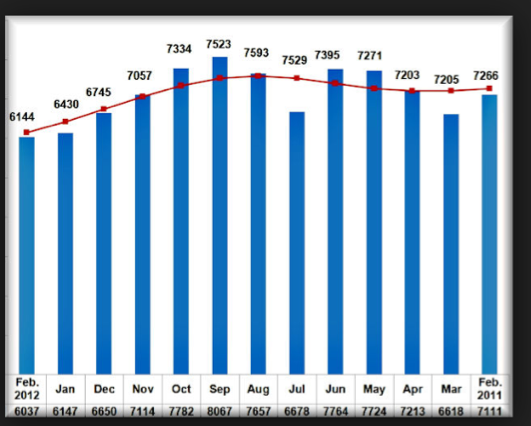
2011-2012
Unemployment Rates
5.2.4.
We can see that there was a much higher during the Great Depression. 1920-1940 diagram is reaching up to 14 million, but the 2011-2012 diagram is only reaching up to about less than 8 thousand. So in conclusion, there was more unemployment in 1920-1940 than 2011-2012.