Sign up for FlowVella
Sign up with FacebookAlready have an account? Sign in now
By registering you are agreeing to our
Terms of Service
Loading Flow

Downloading Image /
Downloading Image /
Downloading Image /
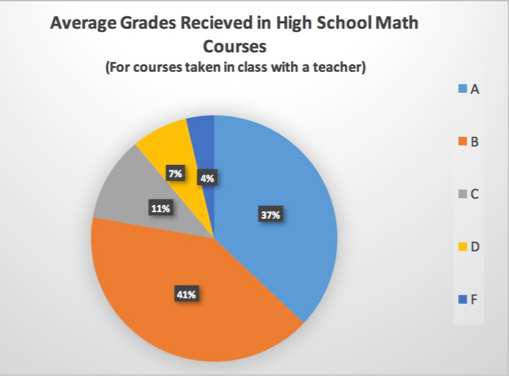
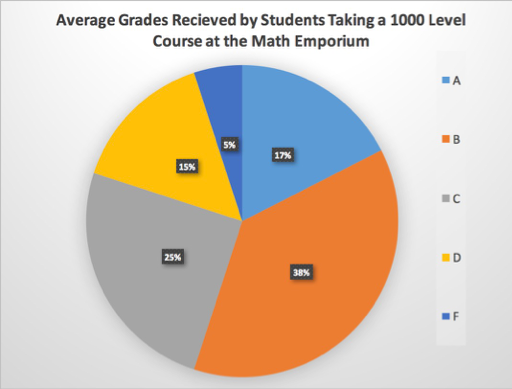
Figure 4: Chart depicting average high school grades in math. Retrieved from a survey conducted by Molly Menoni (2016).
Figure 5: Chart depicting average grades received at the math emporium. Retrieved from a survey conducted by Molly Menoni (2016).
Downloading Image /
Downloading Image /
Downloading Image /
Downloading Image /
Downloading Image /
Downloading Image /
Downloading Image /
Downloading Image /
Downloading Image /
Downloading Image /

FlowVella, Previously Known As Flowboard
© 2026 FlowVella
