Sign up for FlowVella
Sign up with FacebookAlready have an account? Sign in now
By registering you are agreeing to our
Terms of Service
Loading Flow


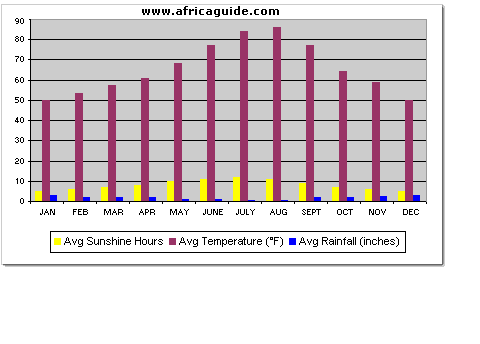
The picture on the right is the monthly temperature of the sahara desert.

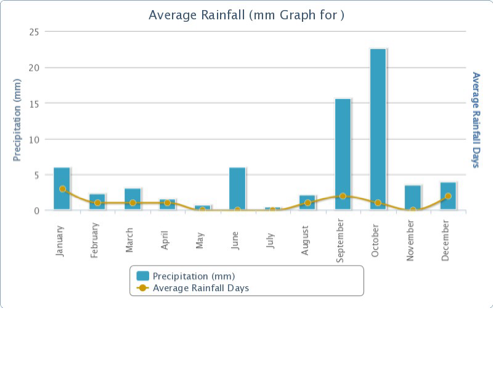
The picture on the left is a graph of the monthly precipitation in the sahara desert.