Sign in to FlowVella

Forgot password?
Sign in with Facebook

New? Create your account

Sign up for FlowVella

Sign up with Facebook

Already have an account? Sign in now


By registering you are agreeing to our
Terms of Service

Share This Flow

Loading Flow

loading...

Downloading Image /

loading...

Downloading Image /

loading...

Downloading Image /

loading...

Downloading Image /

loading...

Downloading Image /

loading...

Downloading Image /

loading...

Downloading Image /

loading...

WHAT WE'RE ABOUT

Graphs

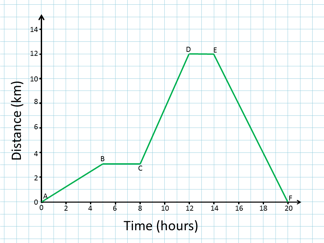
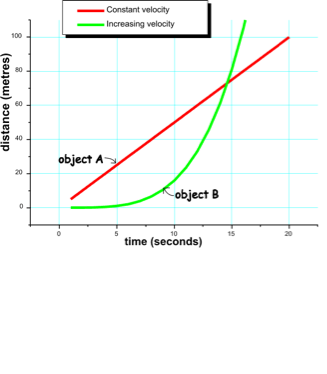
Distance time graphs displays the data of the object of how far and how long it took.
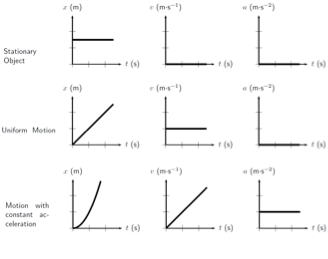
Speed time graphs shows how long the object took and how fast.

This is the independent variable, it is what you change on graphs.


This is the dependent variable, it is what you measure.

Downloading Image /

loading...

Downloading Image /

loading...

Downloading Image /

loading...
  • 1

  • 2

  • 3

  • 4

  • 5

  • 6

  • 7

  • 8

  • 9

  • 10

Mid Term Exam Review Science

By Juni