Sign in to FlowVella

Forgot password?
Sign in with Facebook

New? Create your account

Sign up for FlowVella

Sign up with Facebook

Already have an account? Sign in now


By registering you are agreeing to our
Terms of Service

Share This Flow

Loading Flow

loading...

Downloading Image /

loading...

Downloading Image /

loading...

Downloading Image /

loading...

Downloading Image /

loading...

Downloading Image /

loading...

Downloading Image /

loading...

Downloading Image /

loading...

Downloading Image /

loading...

Downloading Image /

loading...

Downloading Image /

loading...

Downloading Image /

loading...

Downloading Image /

loading...

Downloading Image /

loading...

Downloading Image /

loading...

Downloading Image /

loading...

Downloading Image /

loading...

Downloading Image /

loading...

Downloading Image /

loading...

Downloading Image /

loading...

Downloading Image /

loading...

Appendix

Laboratory Process Guide 2023

APPENDIX


Solderability

Gen3 MUST3

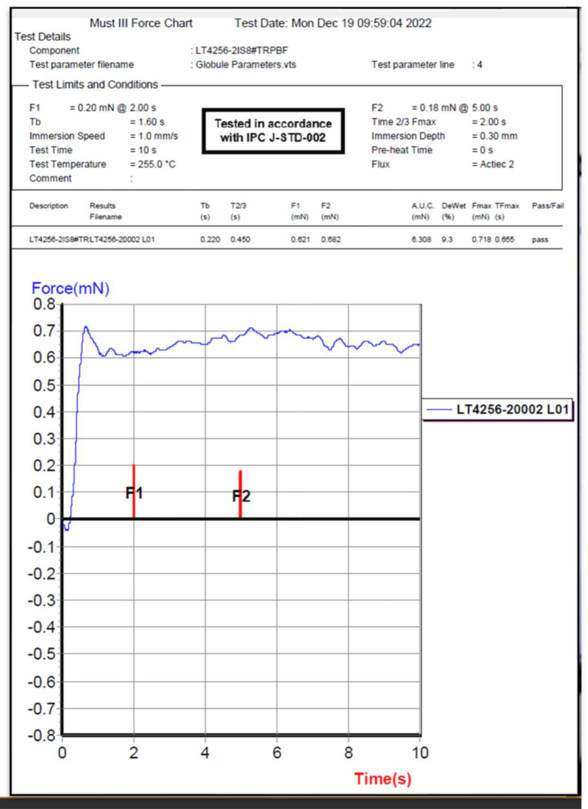
Right; Wetting Balance report – A graph is produced representing the force (in milli-Newtons) required for the termination to ‘wet’. The blue line must climb and continue other the two red parameters (F1 and F2).
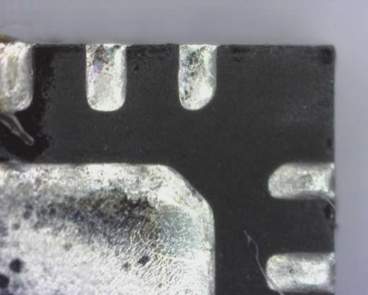
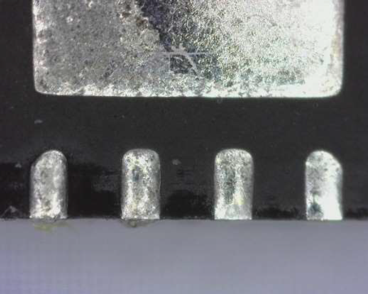
Below; Images taken after a component has been through Dip & Look testing. The Technician is looking at the solder condition and whether there are areas of patchiness and non-adhesion.
21

Downloading Image /

loading...

Downloading Image /

loading...

Downloading Image /

loading...

Downloading Image /

loading...

Downloading Image /

loading...
  • 1

  • 2

  • 3

  • 4

  • 5

  • 6

  • 7

  • 8

  • 9

  • 10

  • 11

  • 12

  • 13

  • 14

  • 15

  • 16

  • 17

  • 18

  • 19

  • 20

  • 21

  • 22

  • 23

  • 24

  • 25

  • 26